

As a regular reader of my blog and this newsletter, you are (likely) not someone who gives much credence to metrics like Views, Impressions, Followers, “Social Halo” (whatever that is). Furthermore, I feel confident saying you have moved your organization beyond the silliness of last-click attribution, you are really obsessive about Cart Abandonment Rate and Checkout Abandonment Rate, and your dashboards are reporting (segmented!) Orders, Average Order Value, and Revenue.
Some of you even measure Economic Value, one of my most favorite KPIs.
This is wonderful. It makes me happy that as a leader, or practicing analyst, you are giving your organization an opportunity to shine by obsessing about metrics that actually matter. #dievanitymetricsdie
I think we can take your business success to a whole new level.
[For optimal learning, I recommend printing out the report below and reading it with a pen handy to take notes. It’ll be fun, I promise.]
A typical custom report that serves as a starting point for your analysis possibly looks like this one from Google Analytics….
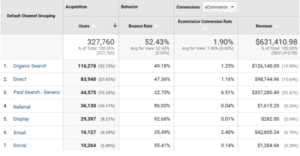
It has a lovely end-to-end view across Acquisition, Behavior, Outcomes (you learned in TMAI #246 why I highly recommend this!). The report also has all the good for your health metrics.
[Pet peeve: It has always irritated me that Google Analytics chooses not to eliminate false precision and displays double decimal points. As in 49.18%. Or $42,805.34. Learn why it is important to not make this mistake in your reports: TMAI #127: Smarter Reporting, Deeper Influence. If for no other reason than that you won’t irritate me!]
The report above, lovely as it is, is not the destination.
Ending on Revenue can be a very misleading destination for an Analyst. It holds the potential to make suboptimal – or even hugely wrong – decisions.
The simplest reason:
The same amount of company effort did not go into each row to earn the revenue in that row. Hence, a direct comparison of performance across rows is imprecise – even foolish.
Let’s dive deeper by comparing the two Search rows, Organic and Paid.
You had to pay for every single one of the 44,575 people who showed up via Paid Search. (33% of whom left without doing anything, ouch!)
You had to pay nothing for the 116,278 people who showed up via Organic Search.
Ergo, it is not a stretch to say that it was cheaper to earn $126k via Organic Search than $337k via Paid Search.
[Note: Organic Search is not free. The folks in your team working on SEO cost money. The SEO tools you might have purchased, like Semrush, deservedly, cost money. You might even have an SEO agency, which, well, costs you money. These people, tools, agency costs also exist for Paid Search and tend to be higher. Tacked on top of that are costs per click.]
As things stand in the report above, an Analyst might recommend exploring how much further you should take Paid Search since it clearly looks amazingly wonderful.
What is the analyst missing? Accounting for the cost of Acquisition!
Let’s say, 44,575 people arrived from Bing Paid Search ads, at an average cost of $5 per click. That could compute to a total cost of Acquisition of $223k.
Let’s redo our revenue calculations:
Revenue from Organic Search: $126k
Revenue from Paid Search: (337-223) = $114k
Is Paid Search still your first obsession?
Maybe not.
At the very minimum, you need to not rush your chq to Bing/Google/Baidu/Seznam.
I suspect you are beginning to see why I’m so deeply obsessive about getting as close as one possibly can to computing Profit. It helps ensure you are getting the most intelligent assessment of value. Stopping at Revenue is a big mistake (that we all make every single day of the year!).
There is a lot that goes into computing real Profit for the company – think of what your Accounting team does and reports to the SEC once a quarter. It can be hard to get to that level of detail. Some of that data might even be sensitive (only available to some teams in your org).
You don’t need to go that far for the concept of Profit to help us be smarter Marketers.
If I simplify things a small bunch, here’s a workable formula that’ll fuel smarter decisions:
Profit =
[Revenue] –
[(Creative Costs) + (Campaign Media Cost + Humans + Fees) + (Cost of Goods Sold)]
Let us look at each of the components of this sexy formula.
Creative Costs.
For many of the channels, the cost of the creative can be as much as the media costs.
A Super Bowl ad costs $1 mil to air but when so many advertisers go all out, it is not uncommon for the creative costs to be multiple times that sum. As an Analyst, you need to account for that.
Ex: One of my all-time fav Super bowl ads, Coca-Cola’s America is Beautiful cost $8 mil to make. Another one of my favs, Chrysler’s Imported from Detroit, cost $12.4 mil.
When you calculate the return on investment, it would be a dereliction of duty to compute ROI of the $1 mil in media cost. It is important to take creative costs into account ($1 + $8 for Coca-Cola).
Creative Costs can contain these elements:
Talent Costs + Production Costs + Agency Fees + Reshooting
If you are using Smart Creative options available on many platforms, like Google Ads, then it is possible that your creative costs are lower.
Still, even there you have to supply logos, headlines, images, descriptions, promotions, etc. Count up the costs of all that, and don’t forget the cost of the humans churning these out, and subtract total from the campaign Revenue.
What’s more likely is that you have a team of 2 – 14 people working with 1 – 3 different agencies and 1 dedicated analyst (for creative testing, and redoing creatives after pre-testing results) to produce creative for digital and non-digital campaigns. This is a massive cost that often gets ignored.
Social ads often requires a bunch of custom display and video creative. For a small company the Talent + Production + Agency + Reshooting costs = $20,000 per month.
In our Google Analytics report above, the revenue from our Social Campaign was $1,285.
Let’s compute Profit: