and its application in Thomas Piketty’s book on “Capital and Ideology”
The discipline of data science and data analytics has exhibited a paradigm shift towards a corporate mindset that is increasingly data -driven. The explosion of Big Data and its accompanying digital ecosystem has just accelerated this shift.
Yet, the marketing sector and more specifically the direct marketing sector were the early pioneers of data and advanced analytics in their quest for more effective decision-making. However, it never fails to impress me that these learned marketing analytics skills can be so easily applied to other disciplines. As an avid reader of books related to history and economics, one such book has captivated my attention in both its narrative but more importantly how this narrative is driven by numbers and data. The book is Thomas Piketty’s book which is his 2nd big tome on inequality entitled “Capital and Ideology”. His first one was “Capital in the 21st Century”. Both his books are about income and wealth inequality but through the rigorous use of data and numbers, he is able to refute the standard myth today amongst many people that growing inequality has still contributed to a growing economy. I am not going to debate the pros and cons of this argument but rather demonstrate to you the reader how the skills of data analytics were used to reinforce some of the key points depicted in this book.
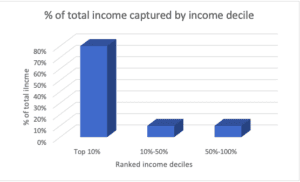
In any data analytics exercise, we need to define what are our measurement goals. Within marketing, it might be acquisition and retention, but what are the KPIS used to measure these goals. If it is retention, then we need to define retention which might be defined as the period of time where a customer has exhibited some activity. For acquisition, it might be the first purchase date or enrollment/registration date. Going back to Piketty’s book, what might be the KPI’s used to measure its goals. Regarding inequality, one useful statistical measure is the Gini coefficient. But the easier metric to display, which is used to calculate the Gini coefficient, is ranked deciles of the population based on income and the % of total income of the entire population captured within that decile. Let’s see what this means. An extreme example of income inequality is Haiti in 1780. See chart below and for raw data inputs to this chart-see Ref.1 in Appendix

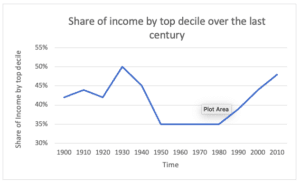
From the above, you can observe that the top 10% account receive 80% of all income in the entire population while the remaining 90% receive only 20% of all income in the entire population. For marketing data analysts and data scientists, charts like this are very familiar as they are commonly used to observe how a given marketing performance or marketing behaviour is distributed throughout the customer base. But let’s probe deeper as one key marketing area of focus has always been the ability to identify change both large and small. In Piketty’s book we are going to look at change over time but focus in on the top income decile only. We are also going to look at the U.S. as the trends are similar across the industrialized democracies of the world. See Chart below and for raw data inputs to this chart-see Ref.2 in Appendix

This chart indicates that the share of income was more uneven prior to World War 2 and then again becoming more uneven after 1980. There are reasons for this which the book explains but the chart highlights information for further exploration. In marketing analytics, this is exemplified by the discipline of data discovery and then probing further to better understand why certain results are occurring.
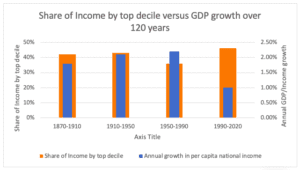
But let’s do some further exploration which is the argument that significant growth in overall income has been occurring since 1980 and which would ultimately increase income overall. But let’s also compare this metric to share of income by the top decile and observe these metrics over time which again is a very common practice amongst marketing analysts. Let’s examine the chart below and for raw data inputs to this chart-see Ref.3 in Appendix

This chart looks at growth of per capita national income which looks at 4 main periods and compares it to the data regarding share of income from the above chart.
- 1870-1910
- 1910-1950
- 1950-1990
- 1990-2020
This chart clearly refutes the notion that overall income has been growing overtime. When we compare income growth to previous periods, it is clear that income growth has been actually declining in the last 30 years (1990-2020) with growing income inequality. In fact, it would appear that income growth is strongest when there is reduced income inequality (1950-1990). Once again, deeper forensics would be required to offer an appropriate rationale for these results.
We are not going to delve deeper into the book as the purpose of this article is to demonstrate how some of the main principles of marketing analytics can be applied in other areas such as Piketty’s book. For marketing analysts and data scientists, this is quite evident. In fact, it just reinforces the notion that the discipline of marketing analytics begun by direct marketers is becoming increasingly cross-functional which will ultimately increase the demand for these types of skillsets.
Appendix
Ref.1: Capital and Ideology by Thomas Piketty (published 2020)-p.260
Ref.2: Capital and Ideology by Thomas Piketty (published 2020)-p.420
Ref.3: Capital and Ideology by Thomas Piketty (published 2020)-p.544


