As companies continue to compete for screentime, the number of hours each day that users spend consuming media has finally plateaued.
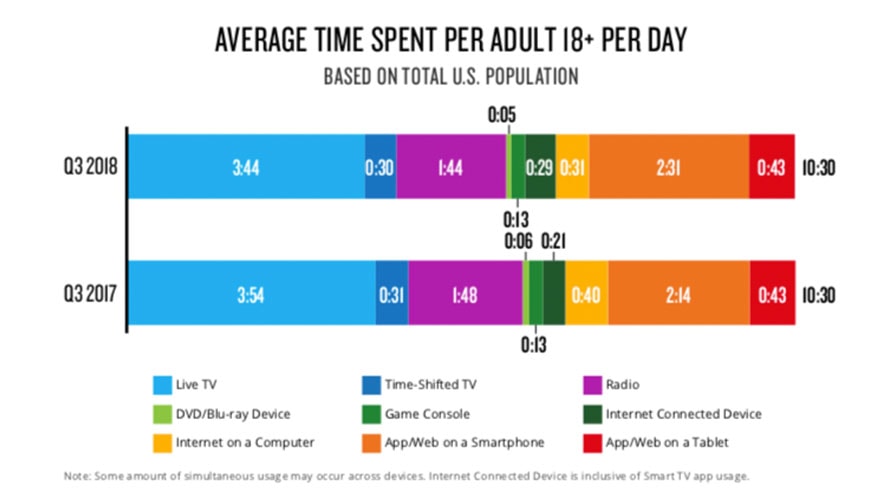
According to Nielsen’s Q3 2018 Total Audience Report, U.S. adults spent an average of 10 hours and 30 minutes per day connected to media, about the same amount as a year ago.
“But there are shifts in where that time being spent is dedicated to, as we see increases in internet-connected devices and app/web smartphone usage that are gradually replacing time spent on other sources,” said Peter Katsingris, svo audience insights, as he introduced the report.
“These shifts are not surprising, as nearly seven out of 10 homes now have a device capable of streaming content and a similar amount have access to a streaming SVOD service.”
This number has remained stagnant over these past two years despite consumers having more streaming options than ever.
Viewing is seasonal, but our consumption average has only increased over the years. Previous Nielsen figures show that in 2002, the typical adult consumed 50 hours of media per week. That number swelled to 80 hours in 2016, largely driven by the additional screens in the marketplace, which includes smartphones and tablets.
If you’re thinking those hours are being driven by millennials—guess again.
According to this latest report, the demographic that consumes the most media is ages 50–64.
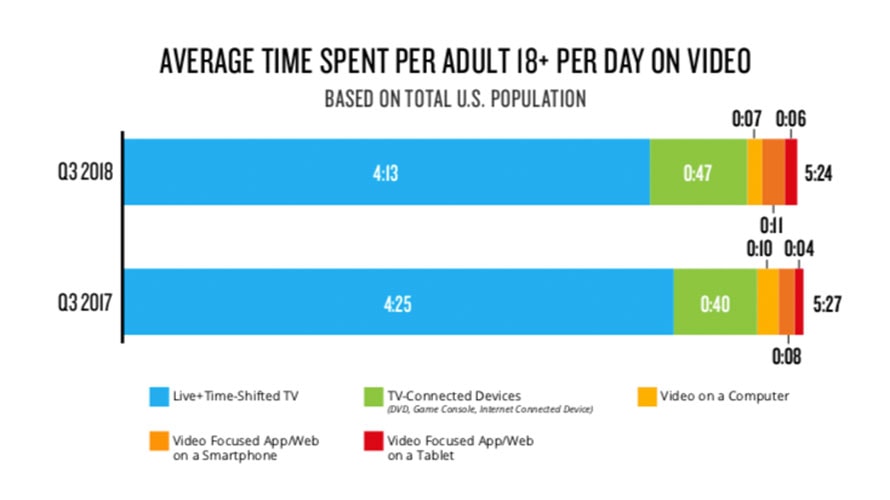
While time spent watching live and time-shifted TV dominated daily media consumption, it decreased a bit from 2017 to 2018, while the time spent watching video on TV connected devices increased.

Live and time-shifted TV slightly decreased from 2017 to 2018.
The amount of time spent watching live TV and listening to the radio fell from 2017 to 2018, while smartphones and game console usage grew year over year.

An increase in smartphone usage seemed to make up for year over year live TV declines.
When people were asked…


